Apply formatting
Description
Apply formatting
Usage
apply_frmt(frmt_def, .data, value, mock = FALSE, ...) ## S3 method for class 'frmt' apply_frmt(frmt_def, .data, value, mock = FALSE, ...) ## S3 method for class 'frmt_combine' apply_frmt( frmt_def, .data, value, mock = FALSE, param, column, label, group, ... ) ## S3 method for class 'frmt_when' apply_frmt(frmt_def, .data, value, mock = FALSE, ...)apply_frmt(frmt_def, .data, value, mock = FALSE, ...) ## S3 method for class 'frmt' apply_frmt(frmt_def, .data, value, mock = FALSE, ...) ## S3 method for class 'frmt_combine' apply_frmt( frmt_def, .data, value, mock = FALSE, param, column, label, group, ... ) ## S3 method for class 'frmt_when' apply_frmt(frmt_def, .data, value, mock = FALSE, ...)
Arguments
frmt_def |
formatting to be applied |
.data |
data, but only what is getting changed |
value |
value symbol should only be one |
mock |
Logical value is this is for a mock or not. By default |
... |
additional arguments for methods |
param |
param column as a quosure |
column |
column columns as a list of quosures |
label |
label column as a quosure |
group |
group column as a list of quosures |
Value
formatted dataset
Examples
library(tibble) library(dplyr) # Set up data df <- tibble(x = c(20.12,34.54,12.34)) apply_frmt( frmt_def = frmt("XX.X"), .data=df, value=quo(x))library(tibble) library(dplyr) # Set up data df <- tibble(x = c(20.12,34.54,12.34)) apply_frmt( frmt_def = frmt("XX.X"), .data=df, value=quo(x))
Big N Structure
Description
Big N structure allows you to specify which values should become the subject
totals ("big N" values) and how they should be formatted in the table's
column labels. Values are specified by providing the value(s) of the param
column for which the values are big N's. This will remove these from the
body of the table and place them into columns matching the values in the
column column(s). The default formatting is N = xx, on its own line, but
that can be changed by providing a different frmt() to n_frmt.
Usage
big_n_structure(param_val, n_frmt = frmt("\nN = xx"), by_page = FALSE)big_n_structure(param_val, n_frmt = frmt("\nN = xx"), by_page = FALSE)
Arguments
param_val |
row value(s) of the parameter column for which the values are big N's |
n_frmt |
|
by_page |
Option to include different big N's for each group-defined set
of pages (defined by any variables set to |
Value
big_n_structure object
See Also
Table Body Plan
Description
Define the formatting of the body contents of the table through a series of frmt_structures. Structures get applied in order from bottom up, so the last added structure is the first applied.
Usage
body_plan(...)body_plan(...)
Arguments
... |
list of frmt_structures defining the body formatting |
Value
body_plan object
See Also
frmt_structure() defines which rows the formats will be applied
to, and frmt(), frmt_combine(), and frmt_when() define the format
semantics.
Examples
tfrmt_spec<- tfrmt( title = "Table Title", body_plan = body_plan( frmt_structure( group_val = c("group1"), label_val = ".default", frmt("XXX") ) ) )tfrmt_spec<- tfrmt( title = "Table Title", body_plan = body_plan( frmt_structure( group_val = c("group1"), label_val = ".default", frmt("XXX") ) ) )
Define the Column Plan & Span Structures
Description
Using <tidy-select> expressions and a series
span_structures, define the order of the columns. The selection follows "last
selected" principals, meaning columns are moved to the last selection as
opposed to preserving the first location.
Usage
col_plan(..., .drop = FALSE) span_structure(...)col_plan(..., .drop = FALSE) span_structure(...)
Arguments
... |
For a col_plan and span_structure,
< |
.drop |
Boolean. Should un-listed columns be dropped from the data. Defaults to FALSE. |
Details
Column Selection
When col_plan gets applied and is used to create the output table, the underlying logic sorts out which column specifically is being selected. If a column is selected twice, the last instance in which the column is selected will be the location it gets rendered.
Avoid beginning the col_plan() column selection with a deselection (i.e.
col_plan(-col1), col_plan(-starts_with("value"))). This will
result in the table preserving all columns not "de-selected" in the
statement, and the order of the columns not changed. It is preferred when
creating the col_plan() to identify all the columns planned on
preserving in the order they are wished to appear, or if
<tidy-select> arguments - such as
everything- are used, identify the de-selection after
the positive-selection.
Alternatively, once the gt table is produced, use the
cols_hide function to remove un-wanted columns.
Value
col_plan object
span_structure object
Images
Here are some example outputs:

See Also
Examples
library(dplyr) ## select col_1 as the first column, remove col_last, then create spanning ## structures that have multiple levels ## ## examples also assume the tfrmt has the column argument set to c(c1, c2, c3) ## spanning_col_plan_ex <- col_plan( col_1, -col_last, span_structure( c1 = "Top Label Level 1", c2 = "Second Label Level 1.1", c3 = c(col_3, col_4) ), span_structure( c1 = "Top Label Level 1", c2 = "Second Label Level 1.2", c3 = starts_with("B") ), span_structure( c1 = "Top Label Level 1", c3 = col_5 ), span_structure( c2 = "Top Label Level 2", c3 = c(col_6, col_7) ) ) ## select my_col_1 as the first column, then ## rename col_2 to new_col_1 and put as the ## second column, then select the rest of the columns renaming_col_plan_ex <- col_plan( my_col_1, new_col_1 = col_2, everything() ) renaming_col_plan_ex2 <- col_plan( my_col_1, new_col_1 = col_2, span_structure( c1 = c(`My Favorite span name` = "Top Label Level 1"), c3 = c(`the results column` = col_5) ) ) ## To one or more stub headers rename the corresponding group/label variables in the column plan. ## If multiple group variables exist, any of them can be renamed. ## Note: Multiple stub headers are only possible if the `row_grp_plan` label ## location is set to "column". Otherwise, if more than one group/label column is renamed, ## {tfrmt} will use the highest level group name available. renaming_group <- col_plan( my_grp = group, # rename group label, starts_with("col") )library(dplyr) ## select col_1 as the first column, remove col_last, then create spanning ## structures that have multiple levels ## ## examples also assume the tfrmt has the column argument set to c(c1, c2, c3) ## spanning_col_plan_ex <- col_plan( col_1, -col_last, span_structure( c1 = "Top Label Level 1", c2 = "Second Label Level 1.1", c3 = c(col_3, col_4) ), span_structure( c1 = "Top Label Level 1", c2 = "Second Label Level 1.2", c3 = starts_with("B") ), span_structure( c1 = "Top Label Level 1", c3 = col_5 ), span_structure( c2 = "Top Label Level 2", c3 = c(col_6, col_7) ) ) ## select my_col_1 as the first column, then ## rename col_2 to new_col_1 and put as the ## second column, then select the rest of the columns renaming_col_plan_ex <- col_plan( my_col_1, new_col_1 = col_2, everything() ) renaming_col_plan_ex2 <- col_plan( my_col_1, new_col_1 = col_2, span_structure( c1 = c(`My Favorite span name` = "Top Label Level 1"), c3 = c(`the results column` = col_5) ) ) ## To one or more stub headers rename the corresponding group/label variables in the column plan. ## If multiple group variables exist, any of them can be renamed. ## Note: Multiple stub headers are only possible if the `row_grp_plan` label ## location is set to "column". Otherwise, if more than one group/label column is renamed, ## {tfrmt} will use the highest level group name available. renaming_group <- col_plan( my_grp = group, # rename group label, starts_with("col") )
Column Style Plan
Description
Define how the columns of the table body should be aligned, whether left, right or on a specific character(s).
Usage
col_style_plan(...)col_style_plan(...)
Arguments
... |
series of col_style_structure objects |
Value
col_style_plan object
See Also
col_style_structure() for more information on how to specify how to and which columns to align.
Examples
plan <- col_style_plan( col_style_structure(col = "my_var", align = "left", width = 100), col_style_structure(col = vars(four), align = "right"), col_style_structure(col = vars(two, three), align = c(".", ",", " ")) )plan <- col_style_plan( col_style_structure(col = "my_var", align = "left", width = 100), col_style_structure(col = vars(four), align = "right"), col_style_structure(col = vars(two, three), align = c(".", ",", " ")) )
Column Style Structure
Description
Column Style Structure
Usage
col_style_structure( col, align = NULL, type = c("char", "pos"), width = NULL, ... )col_style_structure( col, align = NULL, type = c("char", "pos"), width = NULL, ... )
Arguments
col |
Column value to align on from |
align |
Alignment to be applied to column. Defaults to |
type |
Type of alignment: "char" or "pos", for character alignment (default), and positional alignment, respectively. Positional alignment allows for aligning over multiple positions in the column. |
width |
Width to apply to the column in number of characters. Acceptable values include a numeric value, or a character string of a number. |
... |
These dots are for future extensions and must be empty |
Details
Supports alignment and width setting of data value columns (values found in the column column). Row group and label columns are left-aligned by default. Acceptable input values for align differ by type = "char" or "pos":
Character alignment (type = "char"):
-
"left" for left alignment
-
"right" for right alignment"
-
supply a vector of character(s) to align on. If more than one character is provided, alignment will be based on the first occurrence of any of the characters. For alignment based on white space, leading white spaces will be ignored.
Positional alignment (type = "pos"):
supply a vector of strings covering all formatted cell values, with numeric values represented as x's. These values can be created manually or obtained by utilizing the helper display_val_frmts(). Alignment positions will be represented by vertical bars. For example, with starting values: c("12.3", "(5%)", "2.35 (10.23)") we can align all of the first sets of decimals and parentheses by providing align = c("xx|.x", "||(x%)", "x|.xx |")
Value
col_style_structure object
See Also
col_style_plan() for more information on how to combine
col_style_structure()'s together to form a plan.
Examples
plan <- col_style_plan( col_style_structure(col = "my_var", align = c("xx| |(xx%)", "xx|.x |(xx.x - xx.x)"), type = "pos", width = 100), col_style_structure(col = vars(four), align = "right", width = 200), col_style_structure(col = vars(two, three), align = c(".", ",", " ")), col_style_structure(col = c(two, three), width = 25), col_style_structure(col = two, width = 25), col_style_structure(col = span_structure(span = value, col = val2), width = 25) )plan <- col_style_plan( col_style_structure(col = "my_var", align = c("xx| |(xx%)", "xx|.x |(xx.x - xx.x)"), type = "pos", width = 100), col_style_structure(col = vars(four), align = "right", width = 200), col_style_structure(col = vars(two, three), align = c(".", ",", " ")), col_style_structure(col = c(two, three), width = 25), col_style_structure(col = two, width = 25), col_style_structure(col = span_structure(span = value, col = val2), width = 25) )
Adverse Events Analysis Results Data
Description
A dataset containing the results needed for an AE table. Using the CDISC pilot data.
Usage
data_aedata_ae
Format
A data frame with 2,794 rows and 8 variables:
- AEBODSYS
-
highest level row labels: System Organ Class
- AETERM
-
more specific row labels: Preferred Term
- col2
-
higher level column names (spanners)
- col1
-
lower level column names
- param
-
parameter to explain each value
- value
-
values to put in a table
- ord1
-
controls ordering
- ord2
-
more ordering controls
Demography Analysis Results Data
Description
A dataset containing the results needed for a demography table. Using the CDISC pilot data.
Usage
data_demogdata_demog
Format
A data frame with 386 rows and 7 variables:
- rowlbl1
-
highest level row labels
- rowlbl2
-
more specific row labels
- param
-
parameter to explain each value
- grp
-
grouping column used to distinguish continuous and categorical
- ord1
-
controls ordering
- ord2
-
more ordering controls
- column
-
column names
- value
-
values to put in a table
Efficacy Analysis Results Data
Description
A dataset containing the results needed for an Efficacy table. Using the CDISC pilot data for ADAS-Cog(11).
Usage
data_efficacydata_efficacy
Format
A data frame with 70 rows and 7 variables:
- group
-
highest level row labels
- label
-
more specific row labels
- column
-
column names
- param
-
parameter to explain each value
- value
-
values to put in a table
- ord1
-
controls ordering
- ord2
-
more ordering controls
Labs Analysis Results Data
Description
A dataset containing the results needed for an labs results table. Using the CDISC pilot data.
Usage
data_labsdata_labs
Format
A data frame with 4,950 rows and 7 variables:
- group1
-
highest level row labels: Lab value class
- group2
-
more specific row labels: Lab parameter
- rowlbl
-
most specific row labels: Study visit
- col1
-
higher level column names (spanners)
- col2
-
lower level column names
- param
-
parameter to explain each value
- value
-
values to put in a table
- ord1
-
controls ordering
- ord2
-
more ordering controls
- ord3
-
more ordering controls
Display formatting applied to each row
Description
Used when debugging formatting, it is an easy way to allow you to see which formats are applied to each row in your dataset.
Usage
display_row_frmts(tfrmt, .data, convert_to_txt = TRUE)display_row_frmts(tfrmt, .data, convert_to_txt = TRUE)
Arguments
tfrmt |
tfrmt object to apply to the data |
.data |
Data to apply the tfrmt to |
convert_to_txt |
Logical value converting formatting to text, by default
|
Value
formatted tibble
Examples
library(dplyr) library(tidyr) tfrmt_spec <- tfrmt( label = label, column = column, param = param, value=value, body_plan = body_plan( frmt_structure(group_val = ".default", label_val = ".default", frmt_combine( "{count} {percent}", count = frmt("xxx"), percent = frmt_when("==100"~ frmt(""), "==0"~ "", "TRUE" ~ frmt("(xx.x%)")))) )) # Create data df <- tidyr::crossing(label = c("label 1", "label 2"), column = c("placebo", "trt1"), param = c("count", "percent")) |> dplyr::mutate(value=c(24,19,2400/48,1900/38,5,1,500/48,100/38)) display_row_frmts(tfrmt_spec,df)library(dplyr) library(tidyr) tfrmt_spec <- tfrmt( label = label, column = column, param = param, value=value, body_plan = body_plan( frmt_structure(group_val = ".default", label_val = ".default", frmt_combine( "{count} {percent}", count = frmt("xxx"), percent = frmt_when("==100"~ frmt(""), "==0"~ "", "TRUE" ~ frmt("(xx.x%)")))) )) # Create data df <- tidyr::crossing(label = c("label 1", "label 2"), column = c("placebo", "trt1"), param = c("count", "percent")) |> dplyr::mutate(value=c(24,19,2400/48,1900/38,5,1,500/48,100/38)) display_row_frmts(tfrmt_spec,df)
Display formatted values
Description
A helper for creating positional-alignment specifications for the col_style_plan. Returns all unique formatted values to appear in the column(s) specified. Numeric values are represented by x's.
Usage
display_val_frmts(tfrmt, .data, mock = FALSE, col = NULL)display_val_frmts(tfrmt, .data, mock = FALSE, col = NULL)
Arguments
tfrmt |
tfrmt object to apply to the data |
.data |
Data to apply the tfrmt to |
mock |
Mock table? TRUE or FALSE (default) |
col |
Column value to align on from |
Value
text representing character vector of formatted values to be copied and modified in the col_style_plan
Examples
tf_spec <- tfrmt( group = c(rowlbl1,grp), label = rowlbl2, column = column, param = param, value = value, sorting_cols = c(ord1, ord2), body_plan = body_plan( frmt_structure(group_val = ".default", label_val = ".default", frmt_combine("{n} ({pct} %)", n = frmt("xxx"), pct = frmt("xx.x"))), frmt_structure(group_val = ".default", label_val = "n", frmt("xxx")), frmt_structure(group_val = ".default", label_val = c("Mean", "Median", "Min","Max"), frmt("xxx.x")), frmt_structure(group_val = ".default", label_val = "SD", frmt("xxx.xx")), frmt_structure(group_val = ".default", label_val = ".default", p = frmt_when(">0.99" ~ ">0.99", "<0.15" ~ "<0.15", TRUE ~ frmt("x.xxx", missing = ""))) )) display_val_frmts(tf_spec, data_demog, col = vars(everything())) display_val_frmts(tf_spec, data_demog, col = "p-value")tf_spec <- tfrmt( group = c(rowlbl1,grp), label = rowlbl2, column = column, param = param, value = value, sorting_cols = c(ord1, ord2), body_plan = body_plan( frmt_structure(group_val = ".default", label_val = ".default", frmt_combine("{n} ({pct} %)", n = frmt("xxx"), pct = frmt("xx.x"))), frmt_structure(group_val = ".default", label_val = "n", frmt("xxx")), frmt_structure(group_val = ".default", label_val = c("Mean", "Median", "Min","Max"), frmt("xxx.x")), frmt_structure(group_val = ".default", label_val = "SD", frmt("xxx.xx")), frmt_structure(group_val = ".default", label_val = ".default", p = frmt_when(">0.99" ~ ">0.99", "<0.15" ~ "<0.15", TRUE ~ frmt("x.xxx", missing = ""))) )) display_val_frmts(tf_spec, data_demog, col = vars(everything())) display_val_frmts(tf_spec, data_demog, col = "p-value")
Element block
Description
Element block
Usage
element_block(post_space = c(NULL, " ", "-"), fill = TRUE)element_block(post_space = c(NULL, " ", "-"), fill = TRUE)
Arguments
post_space |
Values to show in a new line created after the group block |
fill |
Whether to recycle the value of |
Value
element block object
See Also
row_grp_plan() for more details on how to group row group
structures, row_grp_structure() for more details on how to specify row group
structures, element_row_grp_loc() for more details on how to
specify whether row group titles span the entire table or collapse.
Examples
tfrmt_spec <- tfrmt( group = grp1, label = label, param = param, value = value, column = column, row_grp_plan = row_grp_plan( row_grp_structure(group_val = ".default", element_block(post_space = " ")) ), body_plan = body_plan( frmt_structure(group_val = ".default", label_val = ".default", frmt("xx")) ) )tfrmt_spec <- tfrmt( group = grp1, label = label, param = param, value = value, column = column, row_grp_plan = row_grp_plan( row_grp_structure(group_val = ".default", element_block(post_space = " ")) ), body_plan = body_plan( frmt_structure(group_val = ".default", label_val = ".default", frmt("xx")) ) )
Element Row Group Location
Description
Element Row Group Location
Usage
element_row_grp_loc( location = c("indented", "spanning", "column", "noprint", "gtdefault"), indent = " " )element_row_grp_loc( location = c("indented", "spanning", "column", "noprint", "gtdefault"), indent = " " )
Arguments
location |
Location of the row group labels. Specifying 'indented' combines all group and label variables into a single column with each sub-group indented under its parent. 'spanning' and 'column' retain the highest level group variable in its own column and combine all remaining group and label variables into a single column with sub-groups indented. The highest level group column will either be printed as a spanning header or in its own column in the gt. The 'noprint' option allows the user to suppress group values from being printed. Finally, the 'gtdefault' option allows users to use the 'gt' defaults for styling multiple group columns. |
indent |
A string of the number of spaces you want to indent |
Value
element_row_grp_loc object
Images
Here are some example outputs:

See Also
row_grp_plan() for more details on how to group row group
structures, row_grp_structure() for more details on how to specify row
group structures, element_block() for more details on how to specify
spacing between each group.
Examples
tfrmt_spec <- tfrmt( group = c(grp1, grp2), label = label, param = param, value = value, column = column, row_grp_plan = row_grp_plan(label_loc = element_row_grp_loc(location = "noprint")), body_plan = body_plan( frmt_structure(group_val = ".default", label_val = ".default", frmt("xx")) ) )tfrmt_spec <- tfrmt( group = c(grp1, grp2), label = label, param = param, value = value, column = column, row_grp_plan = row_grp_plan(label_loc = element_row_grp_loc(location = "noprint")), body_plan = body_plan( frmt_structure(group_val = ".default", label_val = ".default", frmt("xx")) ) )
Extract underlying data from tfrmt output
Description
Following a call to print_to_gt, this function extracts the underlying
data frame(s) from the resulting gt or gt_group object.
Usage
extract_data(x, col_delim = "_")extract_data(x, col_delim = "_")
Arguments
x |
A |
col_delim |
Character string to replace the internal "tlang_delim" separator in column names only for tables with spanning headers. Defaults to "_". |
Value
If gt_tbl, a single data frame. If gt_group, a list of data frames.
Footnote Plan
Description
Defining the location and content of footnotes with a series of footnote structures. Each structure is a footnote and can be applied in multiple locations.
Usage
footnote_plan( ..., marks = c("numbers", "letters", "standard", "extended"), order = c("marks_first", "preserve_order", "marks_last") )footnote_plan( ..., marks = c("numbers", "letters", "standard", "extended"), order = c("marks_first", "preserve_order", "marks_last") )
Arguments
... |
a series of |
marks |
type of marks required for footnotes, properties inherited from tab_footnote in 'gt'. Available options are "numbers", "letters", "standard" and "extended" (standard for a traditional set of 4 symbols, extended for 6 symbols). The default option is set to "numbers". |
order |
how to order footnotes in the footer. Options are "marks_first" (anchored notes appear first, default), "preserve_order" or "marks_last" (general notes appear first). |
Value
footnote plan object
Examples
# Adds a footnote indicated by letters rather than numbers to Group 1 footnote_plan <- footnote_plan( footnote_structure(footnote_text = "footnote", group_val = "Group 1"), marks = "letters") # Adds a footnote to the 'Placebo' column footnote_plan <- footnote_plan( footnote_structure(footnote_text = "footnote", column_val = "Placebo"), marks = "numbers") # Preserve order of footnotes footnote_plan <- footnote_plan( footnote_structure(footnote_text = "footnote 1", group_val = "Group 1"), footnote_structure(footnote_text = "footnote 2", column_val = "Placebo"), order = "marks_first")# Adds a footnote indicated by letters rather than numbers to Group 1 footnote_plan <- footnote_plan( footnote_structure(footnote_text = "footnote", group_val = "Group 1"), marks = "letters") # Adds a footnote to the 'Placebo' column footnote_plan <- footnote_plan( footnote_structure(footnote_text = "footnote", column_val = "Placebo"), marks = "numbers") # Preserve order of footnotes footnote_plan <- footnote_plan( footnote_structure(footnote_text = "footnote 1", group_val = "Group 1"), footnote_structure(footnote_text = "footnote 2", column_val = "Placebo"), order = "marks_first")
Footnote Structure
Description
Footnote Structure
Usage
footnote_structure( footnote_text, column_val = NULL, group_val = NULL, label_val = NULL )footnote_structure( footnote_text, column_val = NULL, group_val = NULL, label_val = NULL )
Arguments
footnote_text |
string with text for footnote |
column_val |
string or a named list of strings which represent the column to apply the footnote to |
group_val |
string or a named list of strings which represent the value of group to apply the footnote to |
label_val |
string which represents the value of label to apply the footnote to |
Value
footnote structure object
Examples
# Adds a source note aka a footnote without a symbol in the table footnote_structure <- footnote_structure(footnote_text = "Source Note") # Adds a footnote to the 'Placebo' column footnote_structure <- footnote_structure(footnote_text = "Text", column_val = "Placebo") # Adds a footnote to either 'Placebo' or 'Treatment groups' depending on which # which is last to appear in the column vector footnote_structure <- footnote_structure(footnote_text = "Text", column_val = list(col1 = "Placebo", col2= "Treatment groups")) # Adds a footnote to the 'Adverse Event' label footnote_structure <- footnote_structure("Text", label_val = "Adverse Event")# Adds a source note aka a footnote without a symbol in the table footnote_structure <- footnote_structure(footnote_text = "Source Note") # Adds a footnote to the 'Placebo' column footnote_structure <- footnote_structure(footnote_text = "Text", column_val = "Placebo") # Adds a footnote to either 'Placebo' or 'Treatment groups' depending on which # which is last to appear in the column vector footnote_structure <- footnote_structure(footnote_text = "Text", column_val = list(col1 = "Placebo", col2= "Treatment groups")) # Adds a footnote to the 'Adverse Event' label footnote_structure <- footnote_structure("Text", label_val = "Adverse Event")
Table Value Formatting
Description
These functions provide an abstracted way to approach to define formatting of table contents. By defining in this way, the formats can be layered to be more specific and general cell styling can be done first.
frmt() is the base definition of a format. This defines spacing, rounding,
and missing behaviour.
frmt_combine() is used when two or more rows need to be combined into a
single cell in the table. Each of the rows needs to have a defined frmt()
and need to share a label.
frmt_when() is used when a rows format behaviour is dependent on the value itself and is written similarly to dplyr::case_when().
The left hand side of the equation is a "TRUE"for the default case or the right hand side of a boolean expression ">50".
Usage
frmt(expression, missing = NULL, scientific = NULL, transform = NULL, ...) frmt_combine(expression, ..., missing = NULL) frmt_when(..., missing = NULL)frmt(expression, missing = NULL, scientific = NULL, transform = NULL, ...) frmt_combine(expression, ..., missing = NULL) frmt_when(..., missing = NULL)
Arguments
expression |
this is the string representing the intended format. See details: expression for more a detailed description. |
missing |
when a value is missing that is intended to be formatted, what value to place. See details: missing for more a detailed description. |
scientific |
a string representing the intended scientific notation to be appended to the expression. Ex. "e^XX" or " x10^XX". |
transform |
this is what should happen to the value prior to formatting,
It should be a formula or function. Ex. |
... |
See details: |
Details
expression
-
frmt()All numbers are represented by "x". Any additional character are printed as-is. If additional X's present to the left of the decimal point than the value, they will be represented as spaces. -
frmt_combine()defines how the parameters will be combined as aglue::glue()statement. Parameters need to be equal to the values in the param column and defined in the expression as"{param1} {param2}".
missing
-
frmt()Value to enter when the value is missing. When NULL, the value is "". -
frmt_combine()defines how when all values to be combined are missing. When NULL the value is "".
...
-
frmt()These dots are for future extensions and must be empty. -
frmt_combine()accepts named arguments defining thefrmt()to be applied to which parameters before being combined. -
frmt_when()accepts a series of equations separated by commas, similar todplyr::case_when(). The left hand side of the equation is a"TRUE"for the default case or the right hand side of a boolean expression">50". The right hand side of the equation is thefrmt()to apply when the left side evaluates toTRUE.
Value
frmt object
See Also
body_plan() combines the frmt_structures to be applied to the
table body, and frmt_structure() defines which rows the formats will be applied
to.
Examples
frmt("XXX %") frmt("XX.XXX") frmt("xx.xx", scientific = "x10^xx") frmt_combine( "{param1} {param2}", param1 = frmt("XXX %"), param2 = frmt("XX.XXX") ) frmt_when( ">3" ~ frmt("(X.X%)"), "<=3" ~ frmt("Undetectable") ) frmt_when( "==100"~ frmt(""), "==0"~ "", "TRUE" ~ frmt("(XXX.X%)") )frmt("XXX %") frmt("XX.XXX") frmt("xx.xx", scientific = "x10^xx") frmt_combine( "{param1} {param2}", param1 = frmt("XXX %"), param2 = frmt("XX.XXX") ) frmt_when( ">3" ~ frmt("(X.X%)"), "<=3" ~ frmt("Undetectable") ) frmt_when( "==100"~ frmt(""), "==0"~ "", "TRUE" ~ frmt("(XXX.X%)") )
Format Structure Object
Description
Function needed to create a frmt_structure object, which is a building block
of body_plan(). This specifies the rows the format will be applied to.
Usage
frmt_structure(group_val = ".default", label_val = ".default", ...)frmt_structure(group_val = ".default", label_val = ".default", ...)
Arguments
group_val |
A string or a named list of strings which represent the value of group should be when the given frmt is implemented |
label_val |
A string which represent the value of label should be when the given frmt is implemented |
... |
either a |
Value
frmt_structure object
Images
Here are some example outputs:

See Also
body_plan() combines the frmt_structures to be applied to the
table body, and frmt(), frmt_combine(), and frmt_when() define the
format semantics.
Examples
sample_structure <- frmt_structure( group_val = c("group1"), label_val = ".default", frmt("XXX") ) ## multiple group columns sample_structure <- frmt_structure( group_val = list(grp_col1 = "group1", grp_col2 = "subgroup3"), label_val = ".default", frmt("XXX") )sample_structure <- frmt_structure( group_val = c("group1"), label_val = ".default", frmt("XXX") ) ## multiple group columns sample_structure <- frmt_structure( group_val = list(grp_col1 = "group1", grp_col2 = "subgroup3"), label_val = ".default", frmt("XXX") )
Check if input is a frmt
Description
Check if input is a frmt
Check if input is a frmt_combine
Check if input is a frmt_when
Check if input is a frmt_structure
Check if input is a row_grp_structure
Usage
is_frmt(x) is_frmt_combine(x) is_frmt_when(x) is_frmt_structure(x) is_row_grp_structure(x)is_frmt(x) is_frmt_combine(x) is_frmt_when(x) is_frmt_structure(x) is_row_grp_structure(x)
Arguments
x |
Object to check |
Value
'TRUE' if yes, 'FALSE' if no
Examples
x1 <- frmt("XXX.XX") is_frmt(x1) x2 <- frmt_combine("XXX %","XX,XXX") is_frmt_combine(x2) x2 <- frmt_when( ">3" ~ frmt("(X.X%)"), "<=3" ~ frmt("Undetectable") ) is_frmt_when(x2) x3 <- frmt_structure( group_val = c("group1"), label_val = ".default", frmt("XXX") ) is_frmt_structure(x3) x4 <- row_grp_structure(group_val = c("A","C"), element_block(post_space = "---")) is_row_grp_structure(x4)x1 <- frmt("XXX.XX") is_frmt(x1) x2 <- frmt_combine("XXX %","XX,XXX") is_frmt_combine(x2) x2 <- frmt_when( ">3" ~ frmt("(X.X%)"), "<=3" ~ frmt("Undetectable") ) is_frmt_when(x2) x3 <- frmt_structure( group_val = c("group1"), label_val = ".default", frmt("XXX") ) is_frmt_structure(x3) x4 <- row_grp_structure(group_val = c("A","C"), element_block(post_space = "---")) is_row_grp_structure(x4)
json to tfrmt
Description
Reader to read JSON files/objects into tfrmt objects
Usage
json_to_tfrmt(path = NULL, json = NULL)json_to_tfrmt(path = NULL, json = NULL)
Arguments
path |
location of the json file to read in |
json |
json object to read in. By default this is null. This function will read in json object preferentially. So if both a path and a json object are supplied the json object will be read in. |
Layer tfrmt objects together
Description
Provide utility for layering tfrmt objects together. If both tfrmt's have values, it will preferentially choose the second tfrmt by default. This is an alternative to piping together tfrmt's
Usage
layer_tfrmt(x, y, ..., join_body_plans = TRUE)layer_tfrmt(x, y, ..., join_body_plans = TRUE)
Arguments
x, y
|
tfrmt objects that need to be combined |
... |
arguments passed to layer_tfrmt_arg functions for combining different tfrmt elements |
join_body_plans |
should the |
Details
join_body_plan
When combining two body_plans, the body plans will stack together, first the body plan from x tfrmt then y tfrmt. This means that frmt_structures in y will take priority over those in x.
Combining two tfrmt with large body_plans can lead to slow table evaluation.
Consider setting join_body_plan to FALSE. Only the y body_plan will be
preserved.
Value
tfrmt object
Examples
tfrmt_1 <- tfrmt(title = "title1") tfrmt_2 <- tfrmt(title = "title2",subtitle = "subtitle2") layered_table_format <- layer_tfrmt(tfrmt_1, tfrmt_2)tfrmt_1 <- tfrmt(title = "title1") tfrmt_2 <- tfrmt(title = "title2",subtitle = "subtitle2") layered_table_format <- layer_tfrmt(tfrmt_1, tfrmt_2)
Make mock data for display shells
Description
Make mock data for display shells
Usage
make_mock_data(tfrmt, .default = 1:3, n_cols = NULL)make_mock_data(tfrmt, .default = 1:3, n_cols = NULL)
Arguments
tfrmt |
tfrmt object |
.default |
Number of unique levels to create for group/label values set to ".default" |
n_cols |
Number of columns in the output table (not including
group/label variables). If not supplied it will default to using the
|
Value
tibble containing mock data
Examples
tfrmt_spec <- tfrmt( label = label, column = column, param = param, value=value, body_plan = body_plan( frmt_structure(group_val=".default", label_val=".default", frmt("xx.x")) ) ) make_mock_data(tfrmt_spec)tfrmt_spec <- tfrmt( label = label, column = column, param = param, value=value, body_plan = body_plan( frmt_structure(group_val=".default", label_val=".default", frmt("xx.x")) ) ) make_mock_data(tfrmt_spec)
Page Plan
Description
Defining the location and/or frequency of page splits with a series of page_structure's and the row_every_n argument, respectively.
Usage
page_plan( ..., note_loc = c("noprint", "preheader", "subtitle", "source_note"), max_rows = NULL, transform = NULL )page_plan( ..., note_loc = c("noprint", "preheader", "subtitle", "source_note"), max_rows = NULL, transform = NULL )
Arguments
... |
a series of |
note_loc |
Location of the note describing each table's subset value(s).
Useful if the |
max_rows |
Option to set a maximum number of rows per page. Takes a numeric value. |
transform |
It should take a character vector as input and return a modified character vector as output. A function is used as is, e.g. A formula, e.g. |
Value
page_plan object
Examples
# use of page_struct page_plan( page_structure( group_val = "grp1", label_val = "lbl1" ) ) # use of # rows page_plan( max_rows = 5 ) # use of transform with a formula page_plan( page_structure(group_val = ".default"), transform = ~ stringr::str_replace(.x, "grp", "Group") ) # use of transform with a function transformation_function <- function(x) { stringr::str_replace(x, "grp", "Group") } page_plan( page_structure(group_val = ".default"), transform = transformation_function )# use of page_struct page_plan( page_structure( group_val = "grp1", label_val = "lbl1" ) ) # use of # rows page_plan( max_rows = 5 ) # use of transform with a formula page_plan( page_structure(group_val = ".default"), transform = ~ stringr::str_replace(.x, "grp", "Group") ) # use of transform with a function transformation_function <- function(x) { stringr::str_replace(x, "grp", "Group") } page_plan( page_structure(group_val = ".default"), transform = transformation_function )
Page structure
Description
Page structure
Usage
page_structure(group_val = NULL, label_val = NULL)page_structure(group_val = NULL, label_val = NULL)
Arguments
group_val |
string or a named list of strings which represent the value of group to split after. Set to ".default" if the split should occur after every unique value of the variable. |
label_val |
string which represents the value of label to split after. Set to ".default" if the split should occur after every unique value of the variable. |
Value
page structure object
Examples
# split page after every unique level of the grouping variable page_structure(group_val = ".default", label_val = NULL) # split page after specific levels page_structure(group_val = "grp1", label_val = "lbl3")# split page after every unique level of the grouping variable page_structure(group_val = ".default", label_val = NULL) # split page after specific levels page_structure(group_val = "grp1", label_val = "lbl3")
Set custom parameter-level significant digits rounding
Description
Set custom parameter-level significant digits rounding
Usage
param_set(...)param_set(...)
Arguments
... |
Series of name-value pairs, optionally formatted using
|
Details
Type param_set() in console to view package defaults. Use of the
function will add to the defaults and/or override included defaults of the
same name. For values that are integers, use NA so no decimal places will
be added.
Value
list of default parameter-level significant digits rounding
Examples
# View included defaults param_set() # Update the defaults param_set("{mean} ({sd})" = c(2,3), "pct" = 1) # Separate mean and SD to different lines param_set("mean" = 2, "sd" = 3) # Add formatting using the glue syntax param_set("{pct} %" = 1)# View included defaults param_set() # Update the defaults param_set("{mean} ({sd})" = c(2,3), "pct" = 1) # Separate mean and SD to different lines param_set("mean" = 2, "sd" = 3) # Add formatting using the glue syntax param_set("{pct} %" = 1)
Prepare bigN stat variables
Description
![[Experimental]](../help/figures/lifecycle-experimental.svg)
prep_big_n():
-
recodes the
"n"stat_nameintobigNfor the desired variables, and -
drops all other
stat_namesfor the same variables.
If your tfrmt contains a big_n_structure() you pass the tfrmt column to
prep_big_n() via vars.
Usage
prep_big_n(df, vars)prep_big_n(df, vars)
Arguments
df |
(data.frame) |
vars |
(character) a vector of variables to prepare |
Value
a data.frame with the same columns as the input. The stat_name
column is modified.
Examples
df <- data.frame( stat_name = c("n", "max", "min", rep(c("n", "N", "p"), times = 2)), context = rep(c("continuous", "hierarchical", "categorical"), each = 3), stat_variable = rep(c("a", "b", "c"), each = 3) ) |> dplyr::bind_rows( data.frame( stat_name = "n", context = "total_n", stat_variable = "d" ) ) prep_big_n( df, vars = c("b", "c") )df <- data.frame( stat_name = c("n", "max", "min", rep(c("n", "N", "p"), times = 2)), context = rep(c("continuous", "hierarchical", "categorical"), each = 3), stat_variable = rep(c("a", "b", "c"), each = 3) ) |> dplyr::bind_rows( data.frame( stat_name = "n", context = "total_n", stat_variable = "d" ) ) prep_big_n( df, vars = c("b", "c") )
Combine variables
Description
A wrapper around tidyr::unite() which pastes several columns into one.
In addition it checks the output is identical to dplyr::coalesce(). If not
identical, the input data.frame is returned unchanged. Useful for uniting
sparsely populated columns, for example when processing an ard that was
created with cards::ard_stack() then shuffled with [shuffle_card()].
If the data is the result of a hierarchical ard stack (with
cards::ard_stack_hierarchical() or
cards::ard_stack_hierarchical_count()), the input is returned unchanged.
This is assessed from the information in the context column which needs to
be present. If the input data does not have a context column, the input
will be returned unmodified.
Usage
prep_combine_vars(df, vars, remove = TRUE)prep_combine_vars(df, vars, remove = TRUE)
Arguments
df |
(data.frame) |
vars |
(character) a vector of variables to unite. If a single variable is supplied, the input is returned unchanged. |
remove |
If |
Value
a data.frame with an additional column, called variable_level or
the input unchanged.
Examples
df <- data.frame( a = 1:6, context = rep("categorical", 6), b = c("a", rep(NA, 5)), c = c(NA, "b", rep(NA, 4)), d = c(NA, NA, "c", rep(NA, 3)), e = c(NA, NA, NA, "d", rep(NA, 2)), f = c(NA, NA, NA, NA, "e", NA), g = c(rep(NA, 5), "f") ) prep_combine_vars( df, vars = c("b", "c", "d", "e", "f", "g") )df <- data.frame( a = 1:6, context = rep("categorical", 6), b = c("a", rep(NA, 5)), c = c(NA, "b", rep(NA, 4)), d = c(NA, NA, "c", rep(NA, 3)), e = c(NA, NA, NA, "d", rep(NA, 2)), f = c(NA, NA, NA, NA, "e", NA), g = c(rep(NA, 5), "f") ) prep_combine_vars( df, vars = c("b", "c", "d", "e", "f", "g") )
Fill missing values in hierarchical variables
Description
Replace NA values in one column conditional on the same row having a
non-NA value in a different column.
The user supplies a vector of columns from which the pairs will be extracted
with a rolling window. For example vars <- c("A", "B", "C") will generate
2 pairs ("A", "B") and ("B", "C"). Therefore the order of the variables
matters.
In each pair the second column B will be filled if A is not missing. One
can choose the value to fill with:
-
"Any {colname}", in this case evaluating to"Any B"is the default. -
Any other value. For example
"Any event"for an adverse effects table. -
the value of pair's first column. In this case, the value of
A.
Usage
prep_hierarchical_fill( df, vars, fill = "Any {colname}", fill_from_left = FALSE )prep_hierarchical_fill( df, vars, fill = "Any {colname}", fill_from_left = FALSE )
Arguments
df |
(data.frame) |
vars |
(character) a vector of variables to generate pairs from. |
fill |
(character) value to replace with. Defaults to |
fill_from_left |
(logical) indicating whether to fill from the left
(first) column in the pair. Defaults to |
Value
a data.frame with the same columns as the input, but in which some the desired columns have been filled pairwise.
Examples
df <- data.frame( x = c(1, 2, NA), y = c("a", NA, "b"), z = rep(NA, 3) ) prep_hierarchical_fill( df, vars = c("x", "y") ) prep_hierarchical_fill( df, vars = c("x", "y"), fill = "foo" ) prep_hierarchical_fill( df, vars = c("x", "y", "z"), fill_from_left = TRUE )df <- data.frame( x = c(1, 2, NA), y = c("a", NA, "b"), z = rep(NA, 3) ) prep_hierarchical_fill( df, vars = c("x", "y") ) prep_hierarchical_fill( df, vars = c("x", "y"), fill = "foo" ) prep_hierarchical_fill( df, vars = c("x", "y", "z"), fill_from_left = TRUE )
Prepare label
Description
Adds a label column which is a combination of stat_label (for continuous
variables) and variable_level (for categorical ones) if these 2 columns are
present in the input data frame.
Usage
prep_label(df)prep_label(df)
Arguments
df |
(data.frame) |
Value
a data.frame with a label column (if the input has the required
columns) or the input unchanged.
Examples
df <- data.frame( variable_level = c("d", "e", "f"), stat_label = c("a", "b", "c"), stat_name = c("n", "N", "n"), context = c("categorical", "continuous", "hierarchical") ) prep_label(df)df <- data.frame( variable_level = c("d", "e", "f"), stat_label = c("a", "b", "c"), stat_name = c("n", "N", "n"), context = c("categorical", "continuous", "hierarchical") ) prep_label(df)
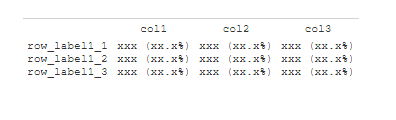
Print mock table to GT
Description
Print mock table to GT
Usage
print_mock_gt( tfrmt, .data = NULL, .default = 1:3, n_cols = NULL, .unicode_ws = TRUE )print_mock_gt( tfrmt, .data = NULL, .default = 1:3, n_cols = NULL, .unicode_ws = TRUE )
Arguments
tfrmt |
tfrmt the mock table will be based off of |
.data |
Optional data. If this is missing, group values, labels values and parameter values will be estimated based on the tfrmt |
.default |
sequence to replace the default values if a dataset isn't provided |
n_cols |
the number of columns. This will only be used if mock data isn't
provided. If not supplied, it will default to using the |
.unicode_ws |
Whether to convert white space to unicode in preparation for output |
Value
a stylized gt object
Examples
  # Create tfrmt specification
  tfrmt_spec <- tfrmt( label = label, column =
  column, param = param, body_plan = body_plan( frmt_structure(group_val =
  ".default", label_val = ".default", frmt_combine( "{count} {percent}",
  count = frmt("xxx"), percent = frmt_when("==100"~ frmt(""), "==0"~ "",
  "TRUE" ~ frmt("(xx.x%)")))) ))

  # Print mock table using default
  print_mock_gt(tfrmt = tfrmt_spec)

  # Create mock data
  df <- tidyr::crossing(label = c("label 1", "label 2",
  "label 3"), column = c("placebo", "trt1", "trt2"), param = c("count",
  "percent"))

  # Print mock table using mock data
  print_mock_gt(tfrmt_spec, df)

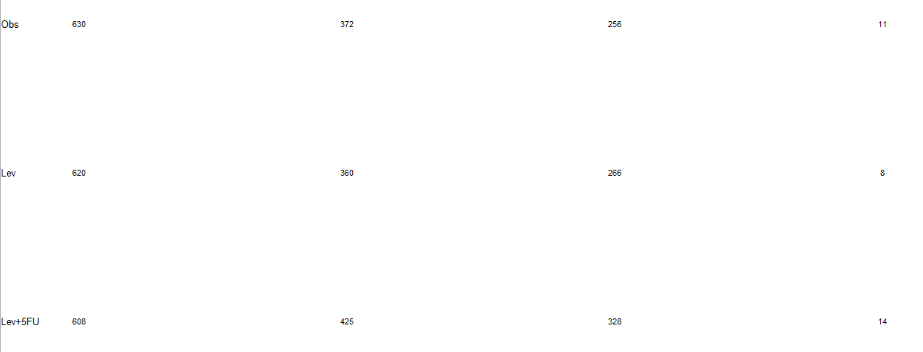
Print to ggplot
Description
Print to ggplot
Usage
print_to_ggplot(tfrmt, .data, ...)print_to_ggplot(tfrmt, .data, ...)
Arguments
tfrmt |
tfrmt object that will dictate the structure of the ggplot object |
.data |
Data to style in order to make the ggplot object |
... |
Inputs to geom_text to modify the style of the table body |
Value
a stylized ggplot object
Examples
# Create data
risk<-tibble(time=c(rep(c(0,1000,2000,3000),3)),
            label=c(rep("Obs",4),rep("Lev",4),rep("Lev+5FU",4)),
            value=c(630,372,256,11,620,360,266,8,608,425,328,14),
            param=rep("n",12))

table<-tfrmt(
 label = label ,
 column = time,
 param = param,
 value = value) |>
  print_to_ggplot(risk)

table
Print to gt
Description
Print to gt
Usage
print_to_gt(tfrmt, .data, .unicode_ws = TRUE)print_to_gt(tfrmt, .data, .unicode_ws = TRUE)
Arguments
tfrmt |
tfrmt object that will dictate the structure of the table |
.data |
Data to style in order to make the table |
.unicode_ws |
Whether to convert white space to unicode in preparation for output |
Value
a stylized gt object
Examples
library(dplyr)
# Create tfrmt specification
tfrmt_spec <- tfrmt(
  label = label,
  column = column,
  param = param,
  value=value,
  body_plan = body_plan(
    frmt_structure(group_val = ".default", label_val = ".default",
                   frmt_combine(
                     "{count} {percent}",
                     count = frmt("xxx"),
                     percent = frmt_when("==100"~ frmt(""),
                                         "==0"~ "",
                                         "TRUE" ~ frmt("(xx.x%)"))))
  ))

# Create data
df <- tidyr::crossing(label = c("label 1", "label 2"),
               column = c("placebo", "trt1"),
               param = c("count", "percent")) |>
      dplyr::mutate(value=c(24,19,2400/48,1900/38,5,1,500/48,100/38))

print_to_gt(tfrmt_spec,df)

Reset or Remove a Component from a tfrmt Object
Description
This utility function allows users to remove a specific component (e.g., body_plan,
row_grp_plan, col_plan) from a tfrmt object by setting it to NULL.
Usage
reset_component(tfrmt_obj, component_name)reset_component(tfrmt_obj, component_name)
Arguments
tfrmt_obj |
A |
component_name |
A character string specifying the name of the component to reset/remove (e.g., "body_plan"). |
Value
A modified tfrmt object with the specified component removed.
Examples
## Not run: my_tfrmt <- tfrmt(column = "col1", label = "label1") # Remove the column component reset_tfrmt <- reset_component(my_tfrmt, "column") ## End(Not run)## Not run: my_tfrmt <- tfrmt(column = "col1", label = "label1") # Remove the column component reset_tfrmt <- reset_component(my_tfrmt, "column") ## End(Not run)
Row Group Plan
Description
Define the look of the table groups on the output. This function allows you to add spaces after blocks and allows you to control how the groups are viewed whether they span the entire table or are nested as a column.
Usage
row_grp_plan(..., label_loc = element_row_grp_loc(location = "indented"))row_grp_plan(..., label_loc = element_row_grp_loc(location = "indented"))
Arguments
... |
Row group structure objects separated by commas |
label_loc |
|
Value
row_grp_plan object
See Also
row_grp_structure() for more details on how to specify row group
structures, element_block() for more details on how to specify spacing
between each group, element_row_grp_loc() for more details on how to
specify whether row group titles span the entire table or collapse.
Examples
## single grouping variable example sample_grp_plan <- row_grp_plan( row_grp_structure(group_val = c("A","C"), element_block(post_space = "---")), row_grp_structure(group_val = c("B"), element_block(post_space = " ")), label_loc = element_row_grp_loc(location = "column") ) ## example with multiple grouping variables sample_grp_plan <- row_grp_plan( row_grp_structure(group_val = list(grp1 = "A", grp2 = "b"), element_block(post_space = " ")), label_loc = element_row_grp_loc(location = "spanning") )## single grouping variable example sample_grp_plan <- row_grp_plan( row_grp_structure(group_val = c("A","C"), element_block(post_space = "---")), row_grp_structure(group_val = c("B"), element_block(post_space = " ")), label_loc = element_row_grp_loc(location = "column") ) ## example with multiple grouping variables sample_grp_plan <- row_grp_plan( row_grp_structure(group_val = list(grp1 = "A", grp2 = "b"), element_block(post_space = " ")), label_loc = element_row_grp_loc(location = "spanning") )
Row Group Structure Object
Description
Function needed to create a row_grp_structure object, which is a building block
of row_grp_plan()
Usage
row_grp_structure(group_val = ".default", element_block)row_grp_structure(group_val = ".default", element_block)
Arguments
group_val |
A string or a named list of strings which represent the value of group should be when the given frmt is implemented |
element_block |
element_block() object to define the block styling |
Value
row_grp_structure object
See Also
row_grp_plan() for more details on how to group row group
structures, element_block() for more details on how to specify spacing
between each group.
Examples
## single grouping variable example row_grp_structure(group_val = c("A","C"), element_block(post_space = "---")) ## example with multiple grouping variables row_grp_structure(group_val = list(grp1 = "A", grp2 = "b"), element_block(post_space = " "))## single grouping variable example row_grp_structure(group_val = c("A","C"), element_block(post_space = "---")) ## example with multiple grouping variables row_grp_structure(group_val = list(grp1 = "A", grp2 = "b"), element_block(post_space = " "))
Shuffle cards
Description
This function ingests an ARD object of class card and shuffles the information to prepare
for analysis. Helpful for streamlining across multiple ARDs.
Usage
shuffle_card( x, by = NULL, trim = TRUE, order_rows = TRUE, fill_overall = "Overall {colname}", fill_hierarchical_overall = "Any {colname}" )shuffle_card( x, by = NULL, trim = TRUE, order_rows = TRUE, fill_overall = "Overall {colname}", fill_hierarchical_overall = "Any {colname}" )
Arguments
x |
an ARD data frame of class 'card' |
by |
Grouping variable(s) used in calculations. Defaults to |
trim |
logical representing whether or not to trim away |
order_rows |
logical representing whether or not to apply
|
fill_overall |
scalar to fill missing grouping or variable levels. If a
character is passed, then it is processed with |
fill_hierarchical_overall |
scalar to fill variable levels for overall
hierarchical calculations. If a character is passed, then it is processed
with |
Value
a tibble
Examples
## Not run: cards::bind_ard( cards::ard_categorical(cards::ADSL, by = "ARM", variables = "AGEGR1"), cards::ard_categorical(cards::ADSL, variables = "ARM") ) |> shuffle_card() ## End(Not run)## Not run: cards::bind_ard( cards::ard_categorical(cards::ADSL, by = "ARM", variables = "AGEGR1"), cards::ard_categorical(cards::ADSL, variables = "ARM") ) |> shuffle_card() ## End(Not run)
Table Format
Description
tfrmt, or "table format" is a way to pre-define the non-data components of your tables, and how the data will be handled once added: i.e. title, footers, headers, span headers, and cell formats. In addition, tfrmt's can be layered, building from one table format to the next. For cases where only one value can be used, the newly defined tfrmt accepts the latest tfrmt
Usage
tfrmt( tfrmt_obj, group = vars(), label = quo(), param = quo(), value = quo(), column = vars(), title, subtitle, row_grp_plan, body_plan, col_style_plan, col_plan, sorting_cols, big_n, footnote_plan, page_plan, ... )tfrmt( tfrmt_obj, group = vars(), label = quo(), param = quo(), value = quo(), column = vars(), title, subtitle, row_grp_plan, body_plan, col_style_plan, col_plan, sorting_cols, big_n, footnote_plan, page_plan, ... )
Arguments
tfrmt_obj |
a tfrmt object to base this new format off of |
group |
what are the grouping vars of the input dataset |
label |
what is the label column of the input dataset |
param |
what is the param column of the input dataset |
value |
what is the value column of the input dataset |
column |
what is the column names column in the input dataset |
title |
title of the table |
subtitle |
subtitle of the table |
row_grp_plan |
plan of the row groups blocking. Takes a |
body_plan |
combination and formatting of the input data. Takes a |
col_style_plan |
how to style columns including alignment (left, right, character) and width. Takes a |
col_plan |
a col_plan object which is used to select, rename, and nest
columns. Takes a |
sorting_cols |
which columns determine sorting of output |
big_n |
how to format subject totals ("big Ns") for inclusion in the column labels. Takes a |
footnote_plan |
footnotes to be added to the table. Takes a |
page_plan |
pagination splits to be applied to the table. Takes a |
... |
These dots are for future extensions and must be empty. |
Details
NSE and Argument Evaluation
-
tfrmt allows users to pass
vars,quo, and unquoted expressions to a variety of arguments, such asgroup,label,param,value,column, andsorting_cols. Users accustomed to tidyverse semantics should be familiar with this behaviour. However, there is an important behaviour difference between tfrmt and normal tidyverse functions. Because the data are not a part of tfrmt, it does not know when a value being passed to it is intended to be an unquoted expression representing a column name or an object from the environment. As such, it preferentially uses the value from the environment over preserving the entry as an expression. For example, if you have an object "my_object" in your environment with the value "Hello world", and try to create a tfrmt astfrmt(column = my_object), it will take the value of "my_object" over assuming the column argument is an unquoted expression and view the entry tocolumnas "Hello World". To pass "my_object" to tfrmt as a column name, use quotes around the value:tfrmt(columnn = "my_object"). -
Additionally, unquoted expressions that match
tfrmt's other argument names can cause unexpected results. It is recommended to put quotes around the value as such:tfrmt(label = "group"). In this case, the quoting will preventtfrmtfrom assigning itsgroupinput value to thelabelvalue.
Value
tfrmt object
Images
Here are some example outputs:

See Also
Examples
tfrmt_spec <- tfrmt( label = label, column = column, param = param, value=value) tfrmt_spec <- tfrmt( label = label, column = column, param = param, value=value, # Set the formatting for values body_plan = body_plan( frmt_structure( group_val = ".default", label_val = ".default", frmt_combine("{n} {pct}", n = frmt("xxx"), pct = frmt_when( "==100" ~ "(100%)", "==0" ~ "", TRUE ~ frmt("(xx.x %)") ) ) ) ), # Specify column styling plan col_style_plan = col_style_plan( col_style_structure(col = vars(everything()), align = c(".",","," ")) )) tfrmt_spec <- tfrmt( group = group, label = label, column = column, param = param, value=value, sorting_cols = c(ord1, ord2), # specify value formatting body_plan = body_plan( frmt_structure( group_val = ".default", label_val = ".default", frmt_combine("{n} {pct}", n = frmt("xxx"), pct = frmt_when( "==100" ~ "(100%)", "==0" ~ "", TRUE ~ frmt("(xx.x %)") ) ) ), frmt_structure( group_val = ".default", label_val = "n", frmt("xxx") ), frmt_structure( group_val = ".default", label_val = c("Mean", "Median", "Min","Max"), frmt("xxx.x") ), frmt_structure( group_val = ".default", label_val = "SD", frmt("xxx.xx") ), frmt_structure( group_val = ".default", label_val = ".default", p = frmt("") ), frmt_structure( group_val = ".default", label_val = c("n","<65 yrs","<12 months","<25"), p = frmt_when( ">0.99" ~ ">0.99", "<0.001" ~ "<0.001", TRUE ~ frmt("x.xxx", missing = "") ) ) ), # remove extra cols col_plan = col_plan(-grp, -starts_with("ord") ), # Specify column styling plan col_style_plan = col_style_plan( col_style_structure(col = vars(everything()), align = c(".",","," ")) ), # Specify row group plan row_grp_plan = row_grp_plan( row_grp_structure( group_val = ".default", element_block(post_space = " ") ), label_loc = element_row_grp_loc(location = "column") ) )tfrmt_spec <- tfrmt( label = label, column = column, param = param, value=value) tfrmt_spec <- tfrmt( label = label, column = column, param = param, value=value, # Set the formatting for values body_plan = body_plan( frmt_structure( group_val = ".default", label_val = ".default", frmt_combine("{n} {pct}", n = frmt("xxx"), pct = frmt_when( "==100" ~ "(100%)", "==0" ~ "", TRUE ~ frmt("(xx.x %)") ) ) ) ), # Specify column styling plan col_style_plan = col_style_plan( col_style_structure(col = vars(everything()), align = c(".",","," ")) )) tfrmt_spec <- tfrmt( group = group, label = label, column = column, param = param, value=value, sorting_cols = c(ord1, ord2), # specify value formatting body_plan = body_plan( frmt_structure( group_val = ".default", label_val = ".default", frmt_combine("{n} {pct}", n = frmt("xxx"), pct = frmt_when( "==100" ~ "(100%)", "==0" ~ "", TRUE ~ frmt("(xx.x %)") ) ) ), frmt_structure( group_val = ".default", label_val = "n", frmt("xxx") ), frmt_structure( group_val = ".default", label_val = c("Mean", "Median", "Min","Max"), frmt("xxx.x") ), frmt_structure( group_val = ".default", label_val = "SD", frmt("xxx.xx") ), frmt_structure( group_val = ".default", label_val = ".default", p = frmt("") ), frmt_structure( group_val = ".default", label_val = c("n","<65 yrs","<12 months","<25"), p = frmt_when( ">0.99" ~ ">0.99", "<0.001" ~ "<0.001", TRUE ~ frmt("x.xxx", missing = "") ) ) ), # remove extra cols col_plan = col_plan(-grp, -starts_with("ord") ), # Specify column styling plan col_style_plan = col_style_plan( col_style_structure(col = vars(everything()), align = c(".",","," ")) ), # Specify row group plan row_grp_plan = row_grp_plan( row_grp_structure( group_val = ".default", element_block(post_space = " ") ), label_loc = element_row_grp_loc(location = "column") ) )
N Percent Template
Description
This function creates an tfrmt for an n % table, so count based table. The
parameter values for n and percent can be provided (by default it will assume
n and pct). Additionally the frmt_when for formatting the percent can
be specified. By default 100% and 0% will not appear and everything between
99% and 100% and 0% and 1% will be rounded using greater than (>) and less
than (<) signs respectively.
Usage
tfrmt_n_pct( n = "n", pct = "pct", pct_frmt_when = frmt_when("==100" ~ frmt(""), ">99" ~ frmt("(>99%)"), "==0" ~ "", "<1" ~ frmt("(<1%)"), "TRUE" ~ frmt("(xx.x%)")), tfrmt_obj = NULL )tfrmt_n_pct( n = "n", pct = "pct", pct_frmt_when = frmt_when("==100" ~ frmt(""), ">99" ~ frmt("(>99%)"), "==0" ~ "", "<1" ~ frmt("(<1%)"), "TRUE" ~ frmt("(xx.x%)")), tfrmt_obj = NULL )
Arguments
n |
name of count (n) value in the parameter column |
pct |
name of percent (pct) value in the parameter column |
pct_frmt_when |
formatting to be used on the the percent values |
tfrmt_obj |
an optional tfrmt object to layer |
Value
tfrmt object
Examples
print_mock_gt(tfrmt_n_pct())
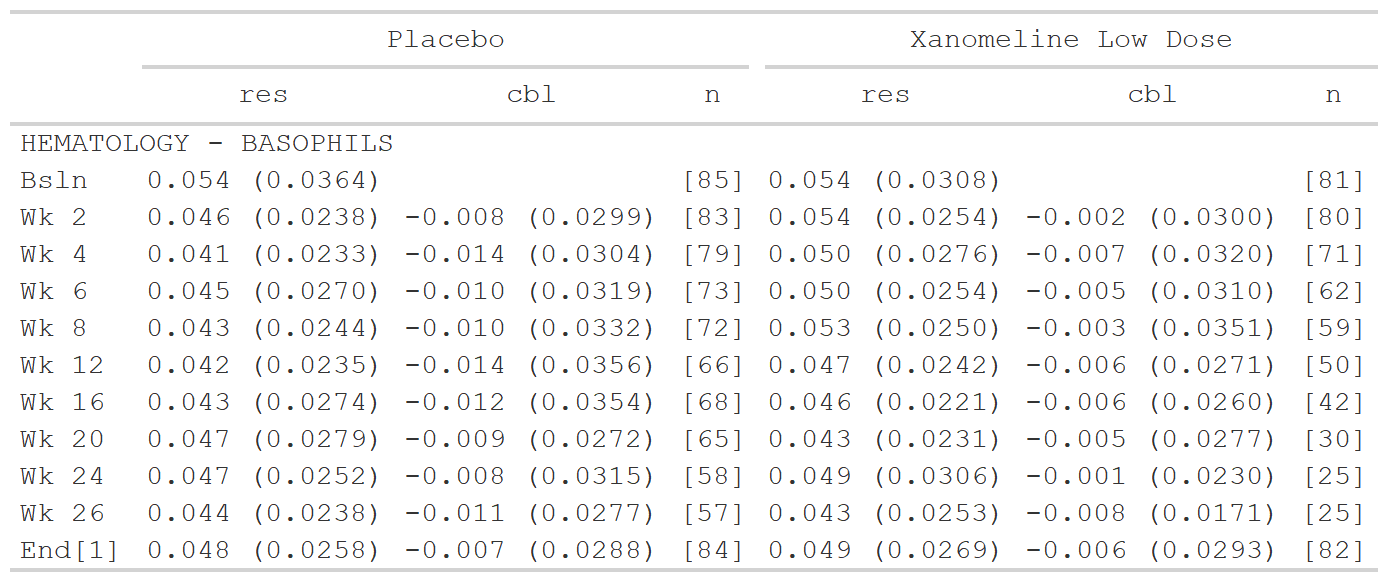
Create tfrmt object from significant digits spec
Description
This function creates a tfrmt based on significant digits specifications for
group/label values. The input data spec provided to sigdig_df will contain
group/label value specifications. tfrmt_sigdig assumes that these columns
are group columns unless otherwise specified. The user may optionally choose
to pass the names of the group and/or label columns as arguments to the
function.
Usage
tfrmt_sigdig( sigdig_df, group = vars(), label = quo(), param_defaults = param_set(), missing = NULL, tfrmt_obj = NULL, ... )tfrmt_sigdig( sigdig_df, group = vars(), label = quo(), param_defaults = param_set(), missing = NULL, tfrmt_obj = NULL, ... )
Arguments
sigdig_df |
data frame containing significant digits formatting spec.
Has 1 record per group/label value, and columns for relevant group and/or
label variables, as well as a numeric column |
group |
what are the grouping vars of the input dataset |
label |
what is the label column of the input dataset |
param_defaults |
Option to override or add to default parameters. |
missing |
missing option to be included in all |
tfrmt_obj |
an optional tfrmt object to layer |
... |
These dots are for future extensions and must be empty. |
Details
Formats covered
Currently covers specifications for frmt and
frmt_combine. frmt_when not supported and must be supplied in additional
tfrmt that is layered on.
Group/label variables
If the group/label variables are not provided to the arguments, the body_plan will be constructed from the input data with the following behaviour:
-
If no group or label are supplied, it will be assumed that all columns in the input data are group columns.
-
If a label variable is provided, but nothing is specified for group, any leftover columns (i.e. not matching
sigdigor the supplied label variable name) in the input data will be assumed to be group columns. -
If any group variable is provided, any leftover columns (i.e. not matching
sigdigor the supplied group/label variable) will be disregarded.
Value
tfrmt object with a body_plan constructed based on the
significant digits data spec and param-level significant digits defaults.
Examples
sig_input <- tibble::tribble(
  ~group1,   ~group2, ~sigdig,
  "CHEMISTRY",   ".default", 3,
  "CHEMISTRY",   "ALBUMIN",  1,
  "CHEMISTRY",   "CALCIUM",   1,
  ".default",    ".default",  2
)

# Subset data for the example
data <- dplyr::filter(data_labs, group2 == "BASOPHILS", col1 %in% c("Placebo", "Xanomeline Low Dose"))
tfrmt_sigdig(sigdig_df = sig_input,
             group = vars(group1, group2),
             label = rowlbl,
             param_defaults = param_set("[{n}]" = NA)) |>
  tfrmt(column = vars(col1, col2),
        param = param,
        value = value,
        sorting_cols = vars(ord1, ord2, ord3),
        col_plan = col_plan(-starts_with("ord"))) |>
  print_to_gt(.data = data)
Print to JSON
Description
Print to JSON
Usage
tfrmt_to_json(tfrmt, path = NULL)tfrmt_to_json(tfrmt, path = NULL)
Arguments
tfrmt |
tfrmt to print |
path |
file path to save JSON to. If not provided the JSON will just print to the console |
Value
JSON
Examples
tfrmt( label = label, column = column, param = param, value=value) |> tfrmt_to_json()tfrmt( label = label, column = column, param = param, value=value) |> tfrmt_to_json()
Remap group values in a tfrmt
Description
Remap group values in a tfrmt
Usage
update_group(tfrmt, ...)update_group(tfrmt, ...)
Arguments
tfrmt |
a |
... |
Use new_name = old_name to rename selected variables |
Value
A tfrmt with the group variables updated in all places
tfrmt object with updated groups#'
Examples
tfrmt_spec <- tfrmt( group = c(group1, group2), body_plan = body_plan( frmt_structure( group_val = list(group2 = "value"), label_val = ".default", frmt("XXX") ), frmt_structure( group_val = list(group1 = "value", group2 = "value"), label_val = ".default", frmt("XXX") ) )) tfrmt_spec %>% update_group(New_Group = group1)tfrmt_spec <- tfrmt( group = c(group1, group2), body_plan = body_plan( frmt_structure( group_val = list(group2 = "value"), label_val = ".default", frmt("XXX") ), frmt_structure( group_val = list(group1 = "value", group2 = "value"), label_val = ".default", frmt("XXX") ) )) tfrmt_spec %>% update_group(New_Group = group1)